Structures Design

 Q. What is the best way to run a FDOT Mathcad program?
A. You should be a local administrator to run the program. Do not run more than one program at a time.

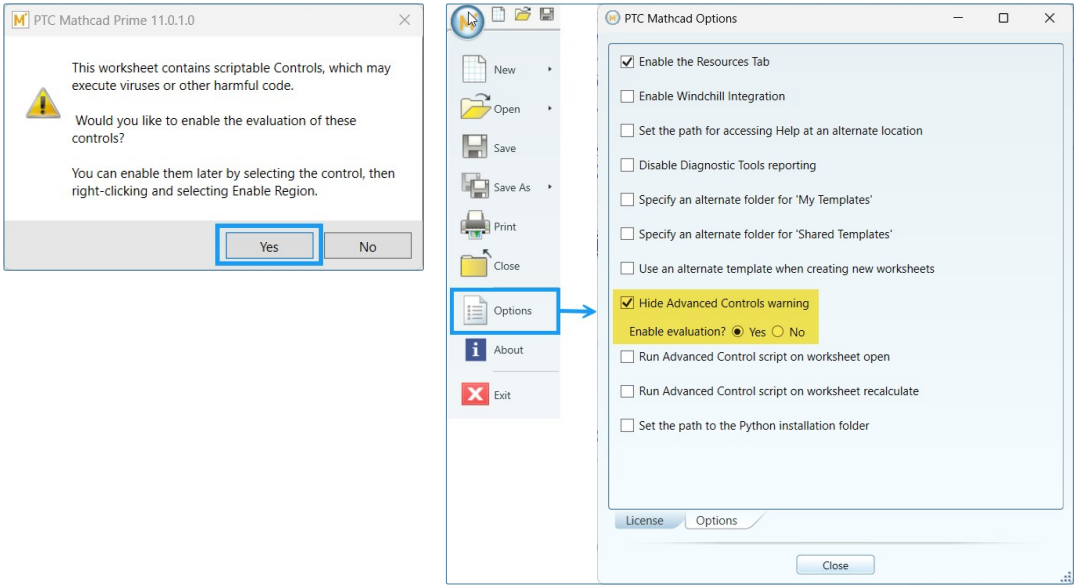
Q. When opening a file, I get the following message: This worksheet contains scriptable objects...Would you like to disable these objects?
A. Choose "No". To prevent this message from recurring each time you open Mathcad, go to the main menubar:
Tools>Preferences>Script Security>Low Security

Q. I am running Windows 10, why am I having problems opening Mathcad?
A. You should be running Mathcad in Windows 7 compatibility mode. Right click on the Mathcad icon, choose properties, then compatibility, then windows 7.

Q. The input fields in the Cantilever/Span Sign programs do not work.
A. Set Windows Display setting to 100%.

Basic Information & Commonly Used Keystrokes

Mathcad evaluates a worksheet by scanning left to right and top to bottom, with the exception of the triple bar equal sign. Before you can evaluate an expression involving a variable, you must define the variable. To do so:
1. Type the variable name.
2. Type ":" to create a ":=" with a placeholder.
3. Type a number or an expression in the placeholder. Mathcad evaluates what you type into the placeholder and assigns the result to the variable name.
4. Retype the variable name, press "=", and Mathcad evaluates the expression you typed and displays the result. To change units on a variable or constant;
1. Click in the variable or constant of an evaluated ("=") variable.
2. Click on the black square on the right side of the variable.
3. Type the name of a unit in the placeholder. Use < Ctrl+X > to Cut a selection to the clipboard.
Use < Ctrl+C > to Copy a selection to the clipboard.
Use < Ctrl+V > to Paste the clipboard contents into a worksheet.
For Matrix subscript, Press < [ >
For Literal subscript, Press < . >
To add an additional variable to a vector variable assignment, Press < , >

Mathcad Operation

Q. Why does the function asin(1) produce the result 1.571? And why does sin(90)=0.894?
A. The default unit for all angles in Mathcad is radians. Since radians are a "dimensionless unit" (they really just represent the fraction of a circle's circumference) they aren't automatically displayed in output. If you'd like to display your result in degrees in the first case, asin(1), select the result, 1.571, in the blue selection box. You'll notice a small black rectangle appear to the right of the number. Click in the rectangle, and enter the letters "deg" for degrees. When you click outside of the equation, you'll see the answer displayed in degrees. When supplying an argument for a trigonometric function, like sin, you'll need to explicitly include the unit degrees, i.e., sin(90*deg) = 1. You're welcome to include the unit rad (for radians) in the same way, but it won't change the value of an answer which is already in radians.

Q. I've created a range variable from 1 to 10, but any vectors I create with this range start with the value 0, and have 11 entries - what's up?
A. Mathcad automatically begins all ranges with zero. There are two ways to address this problem. You can either start your range variable at zero, by defining, for example: i:=0 ; 10. This will produce 11 values of i. You could also reset the origin in the document by typing ORIGIN:=1 at the top of the document. This way, all ranges automatically begin with 1.

Q. What's the difference between using a period to make a subscript, and a left square bracket ( [ )?
A. The period is what's called a "literal subscript." It's really just a label, allowing you to further identify a variable. Whenever you use that variable, you must use it complete with it's literal subscript. In other words, A.myvariable is not at all the same as simply A. The square bracket, on the other hand, is used to create "indexed variables." These variables can be either vectors or two-dimensional matrices, depending on how many indices you use. So, if you want to create a vector of values sin(x), define a "range variable" x (as shown in the previous question) and then create an "indexed variable" as follows: type vec[x := sin(x). This will create the variable vec, which is a vector with x entries, each having the value sin(x). This subscript can also be used to pull the values out of an existing vector or matrix. Suppose I'd like to know the entry in the 5th row and 18th column of matrix M. I would type M[5,18 =. The value at this matrix location would be returned. As with vectors, be sure to remember that the upper leftmost entry of any matrix has the subscript [ 0,0, unless you've reset the ORIGIN.

Q. How do I plot a set of data in Mathcad?
A. There are two ways to go about this. The first way is to create a range variable i := 0 ; numberofdatapoints - 1. Then fill the vectors x[i and y[i with your data. You do this by typing x[i := and then entering your data points separated by commas. You should see the data appear on your screen in a stack of vertical boxes. Do the same for y[i, and then make a plot, plotting x[i on the horizontal axis, and y[i on the vertical axis. If you have a lot of data points, the second way to do this is to make an ascii file containing the data in columns, separated by a tab or a space, and use the READPRN function to read it in. We suggest you see the User's Guide for more information on this approach. Notice that, after you've got vectors containing your data, there are lots of ways to fit and interpolate between the points, such as the slope, intercept, linterp, and genfit functions.

Formatting Problems

Q. Why do several regions in my worksheet overlap?
A. The display and printing of the same worksheet may vary on different computers depending on printer drivers and display settings.  Bitmaps will resize depending on the printer driver chosen, and this may also cause regions to overlap.  The solution in either case is to resize and/or move the regions individually to suit your PC configuration.