


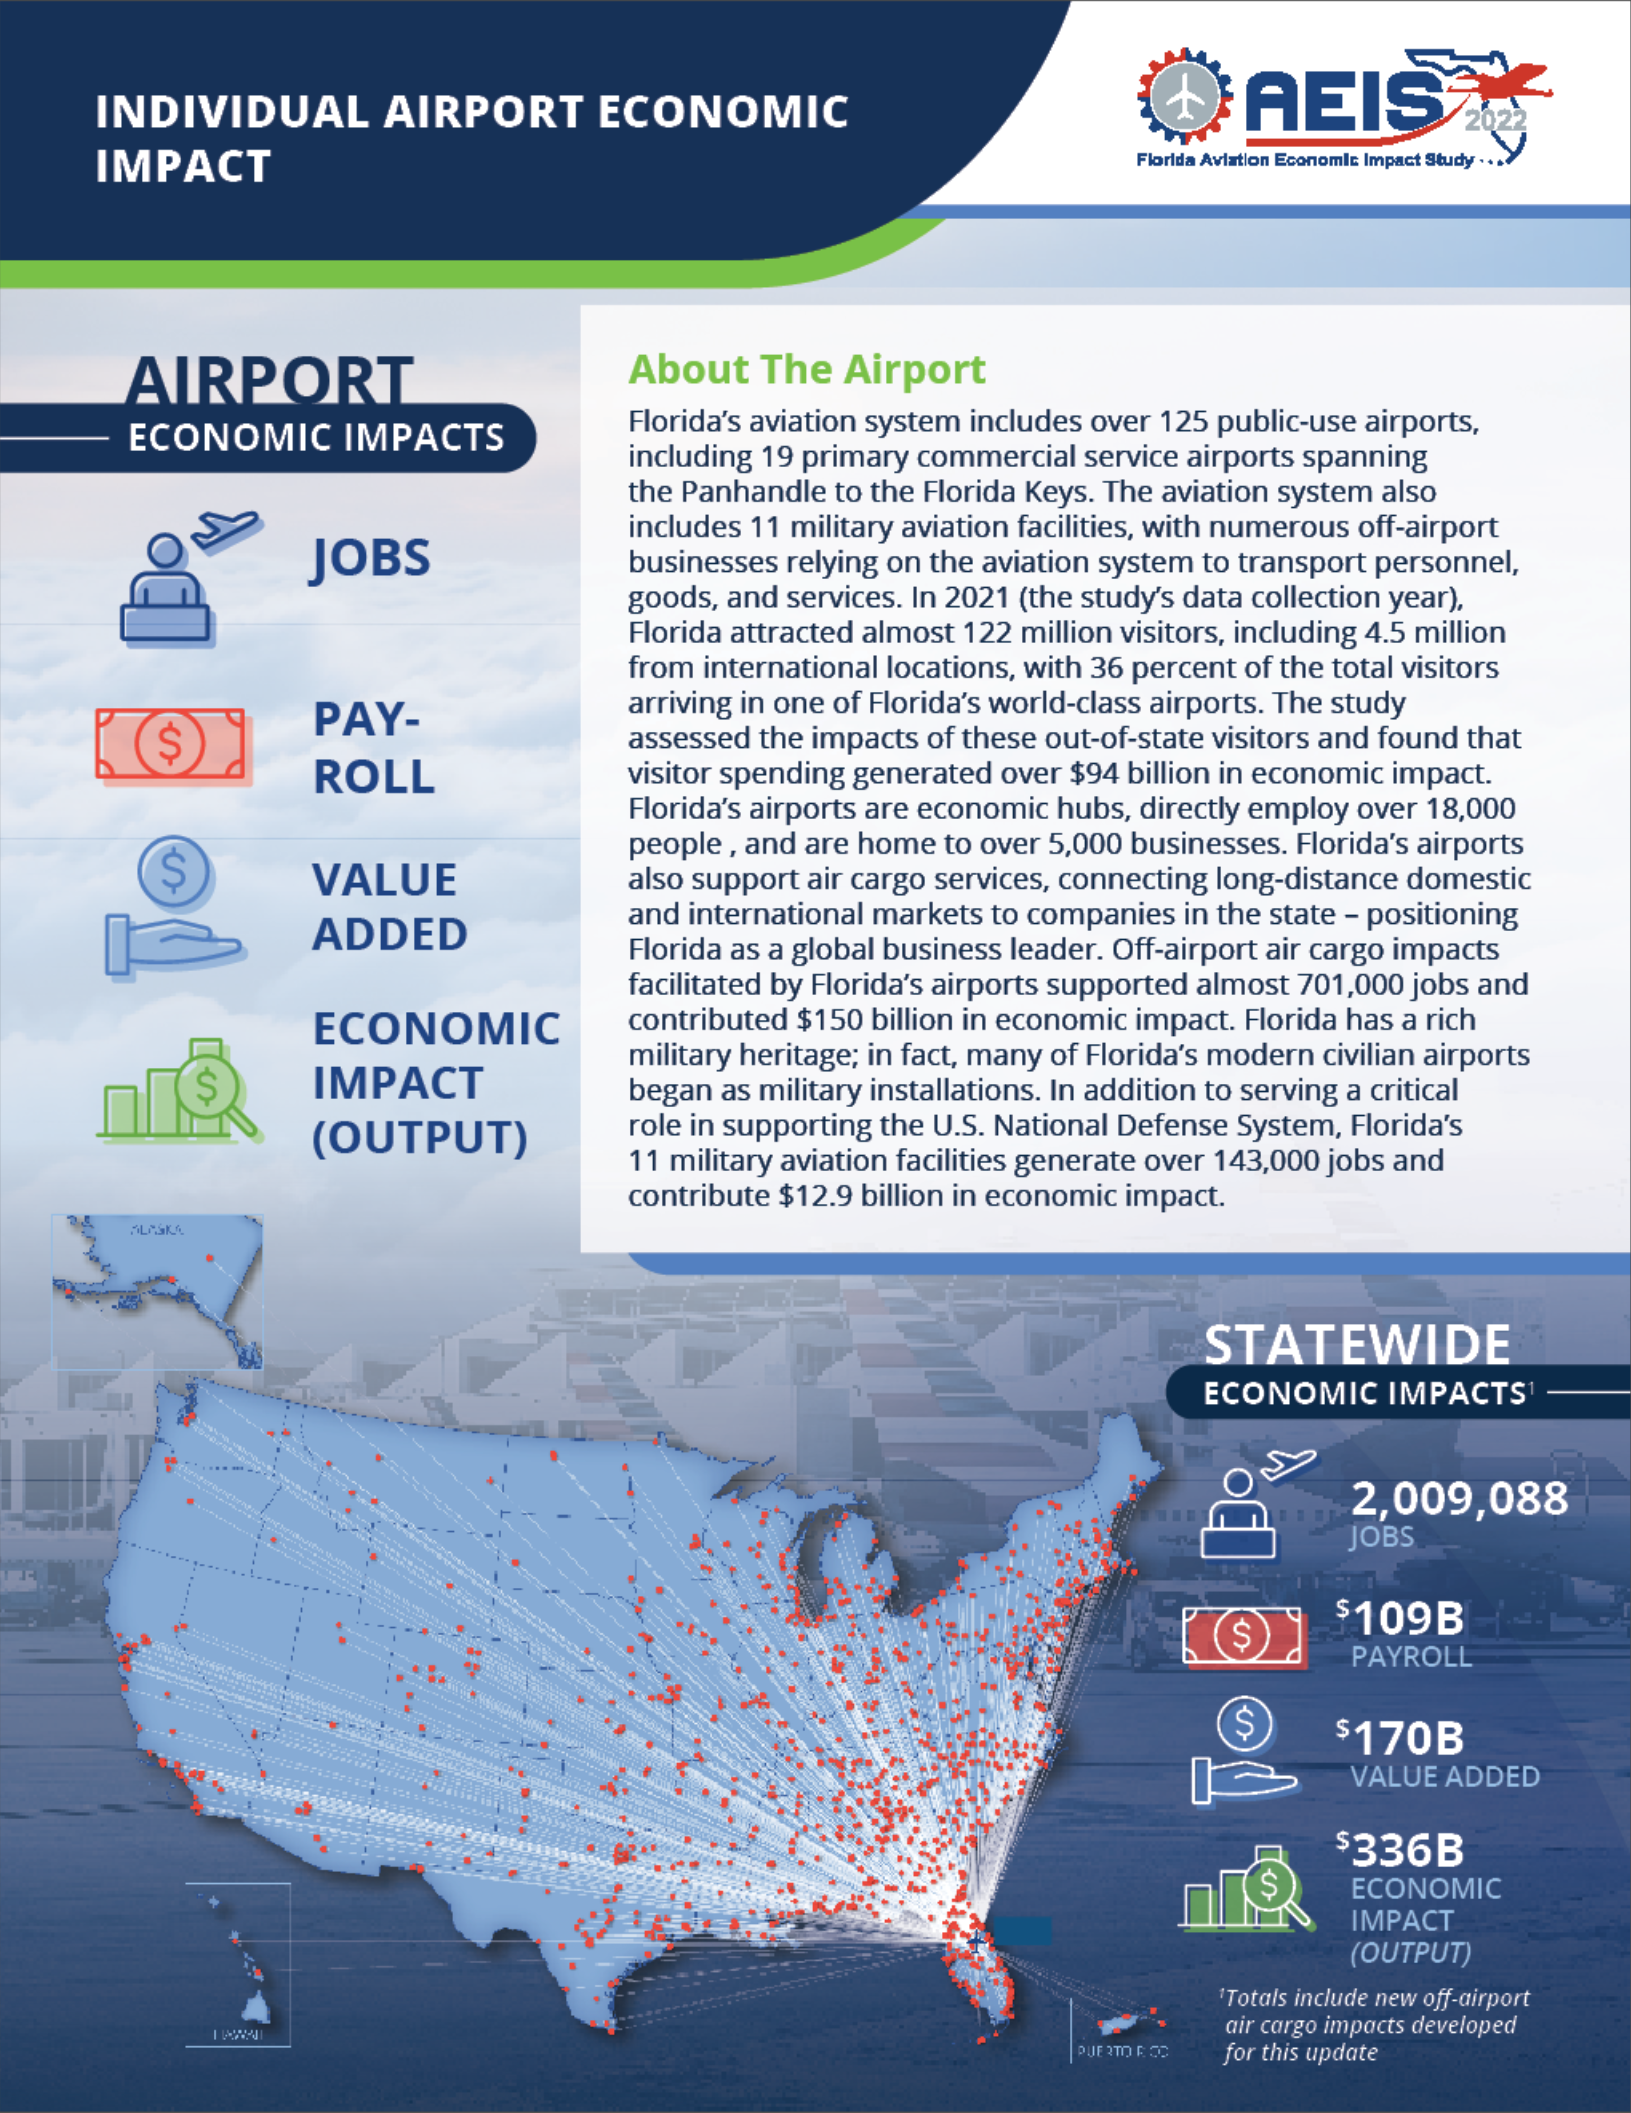
Apart from providing air travel, the figures below represent one of the most important impacts of Florida airports on their communities. The FDOT Aviation Office periodically commissions Statewide Aviation Economic Impact Studies (AEIS) to quantify and communicate the contributions of Florida’s airports and aviation industry at local, regional (FDOT District), and statewide levels. The most recent project, the 2022 Statewide Aviation Economic Impact Study (2022 AEIS) is an update to the previously completed 2019 AEIS and includes quantitative results, qualitative case studies, and real-life stories that justify continued investment for the robust aviation system in the Sunshine State.
 The sum of full-time and part-time employees. Accounts for the total number of people employed
as a result of the airport or company within a defined geography or industry.
The sum of full-time and part-time employees. Accounts for the total number of people employed
as a result of the airport or company within a defined geography or industry.
6,462
 Total compensation for work, including gross wages, salaries, employer-provided benefits
and taxes paid to governments on behalf of employees.
Total compensation for work, including gross wages, salaries, employer-provided benefits
and taxes paid to governments on behalf of employees.
$256M
 Consists of compensation of employees, taxes paid on production and imports, and gross operating surplus.
Value added equals the difference between an industry’s gross output and the cost of its intermediate inputs.
Consists of compensation of employees, taxes paid on production and imports, and gross operating surplus.
Value added equals the difference between an industry’s gross output and the cost of its intermediate inputs.
$442M
 The value of sales or receipts and other operating income along with any inventory change (e.g., spoilage, breakage, or theft).
It is the equivalent of value added plus the cost of all intermediate inputs (including energy, raw materials, semi-finished goods,
and services) that are purchased from all sources/locations.
The value of sales or receipts and other operating income along with any inventory change (e.g., spoilage, breakage, or theft).
It is the equivalent of value added plus the cost of all intermediate inputs (including energy, raw materials, semi-finished goods,
and services) that are purchased from all sources/locations.
$859M
A wide variety of documents and deliverables were developed for the 2022 AEIS, including individual airport brochures and PowerPoint presentations, FDOT District summaries, a statewide executive summary, and a technical report. Explore the economic contributions of this airport with the resources below. The remaining tabs provide additional detail on how Florida’s airports are planned, developed, and funded to continuously provide these substantial economic impacts.
Brochure
Executive Summary
Executive Summary
Technical Report
Archives
| Historical Economic Impact Brochure | ||
|---|---|---|
| Economic Impact 2019 | ||
| Economic Impact 2017 | ||
| Historical Statewide Executive Summary | ||
|---|---|---|
| Statewide Executive Summary 2019 | ||
| Historical Statewide Technical Report | ||
|---|---|---|
| Statewide Technical Report 2019 | ||